Quarterly Summary - Q4 2025
The reporting season for the fourth quarter has now been concluded. It has been an intense period, characterized above all by significant price reactions. Revenue growth came in slightly weaker than expected, while earnings showed greater stability. Below is a summary of the quarter – the figures, the winners, the losers, and the market’s reactions.
The summary is based on 296 companies that received at least 8 estimates on pinpointestimates.com.
Low Growth
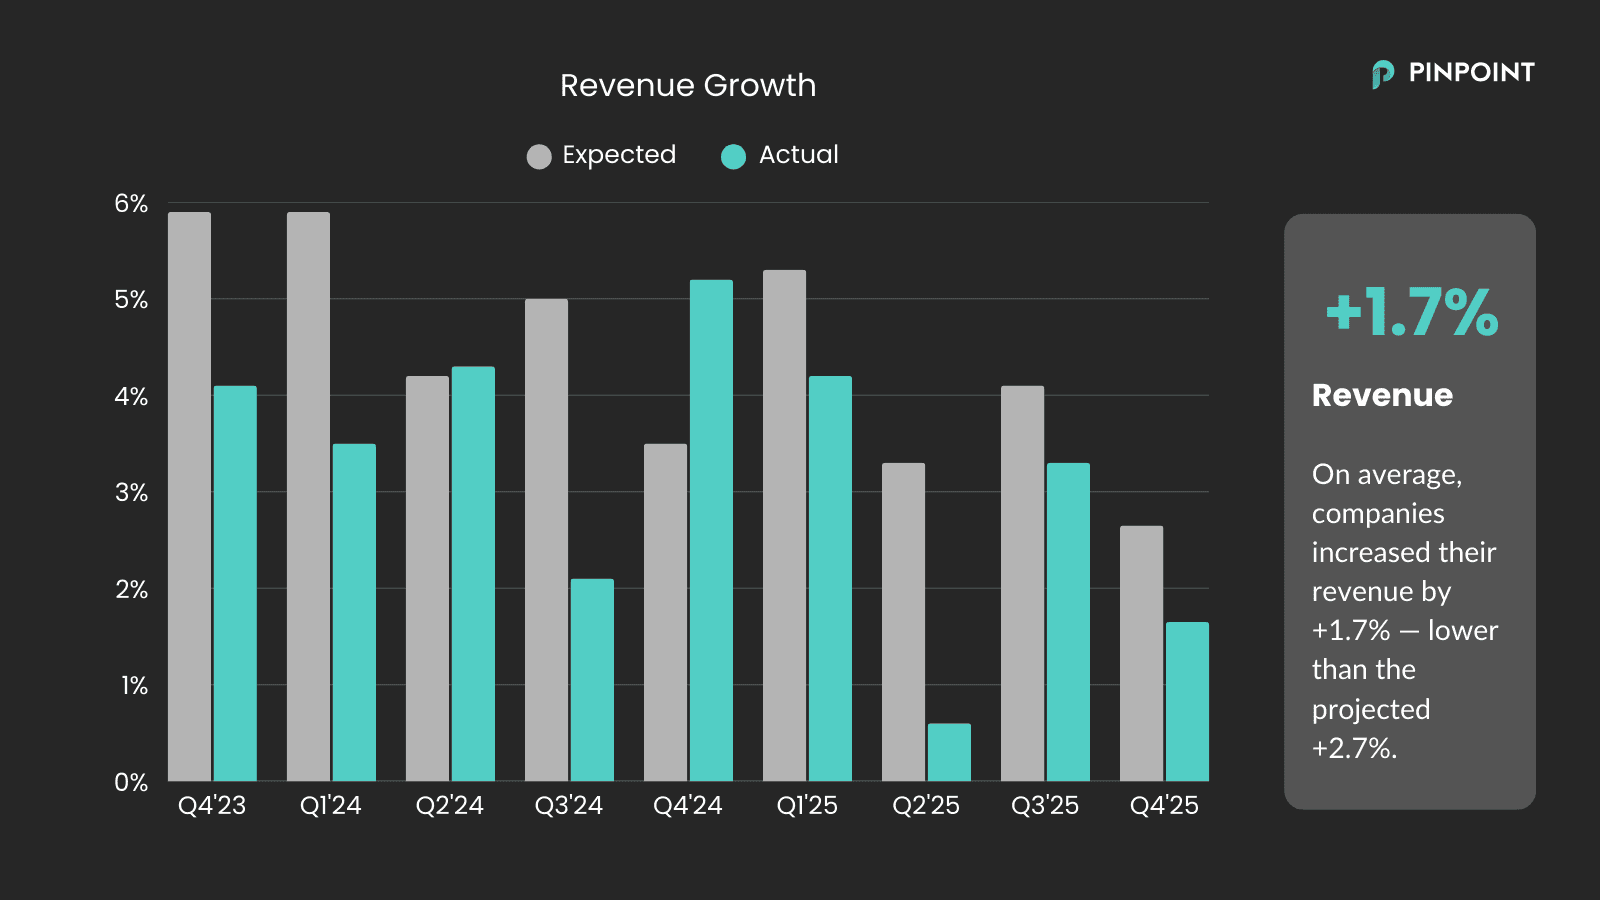
Average revenue growth landed at +1.7%. This is a decline compared to the previous quarter, when companies grew by an average of +3.3%. It should be noted, however, that the comparison quarter from the previous year showed relatively high growth on an aggregate level (+5.2%), resulting in tougher year-on-year comparisons.
The outcome fell short of expectations of +2.7%. This means that revenue growth missed forecasts during every single quarter of 2025.
Earnings Strengthen
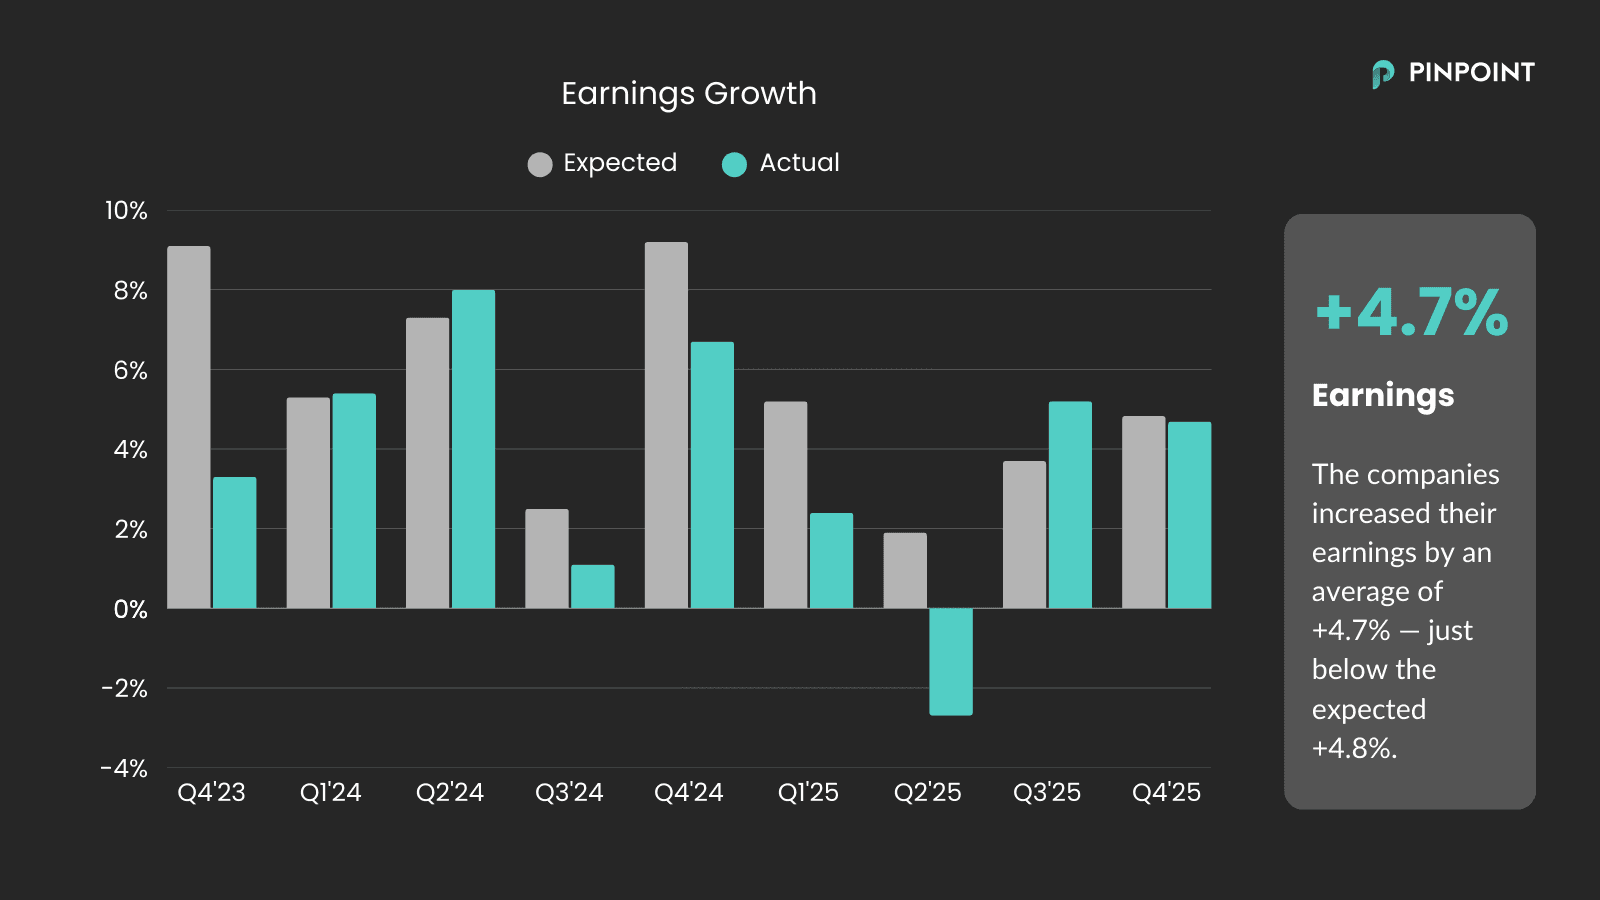
As in the previous quarter, the trend looks better further down the income statement. Earnings increased by an average of +4.7%, largely in line with expectations of +4.8%.
The fact that earnings are growing faster than revenue indicates continued margin expansion on an aggregate level. Cost-cutting and efficiency measures remain recurring themes in the reports and are likely contributing to this development.
All Sectors Growing Slower Than Expected
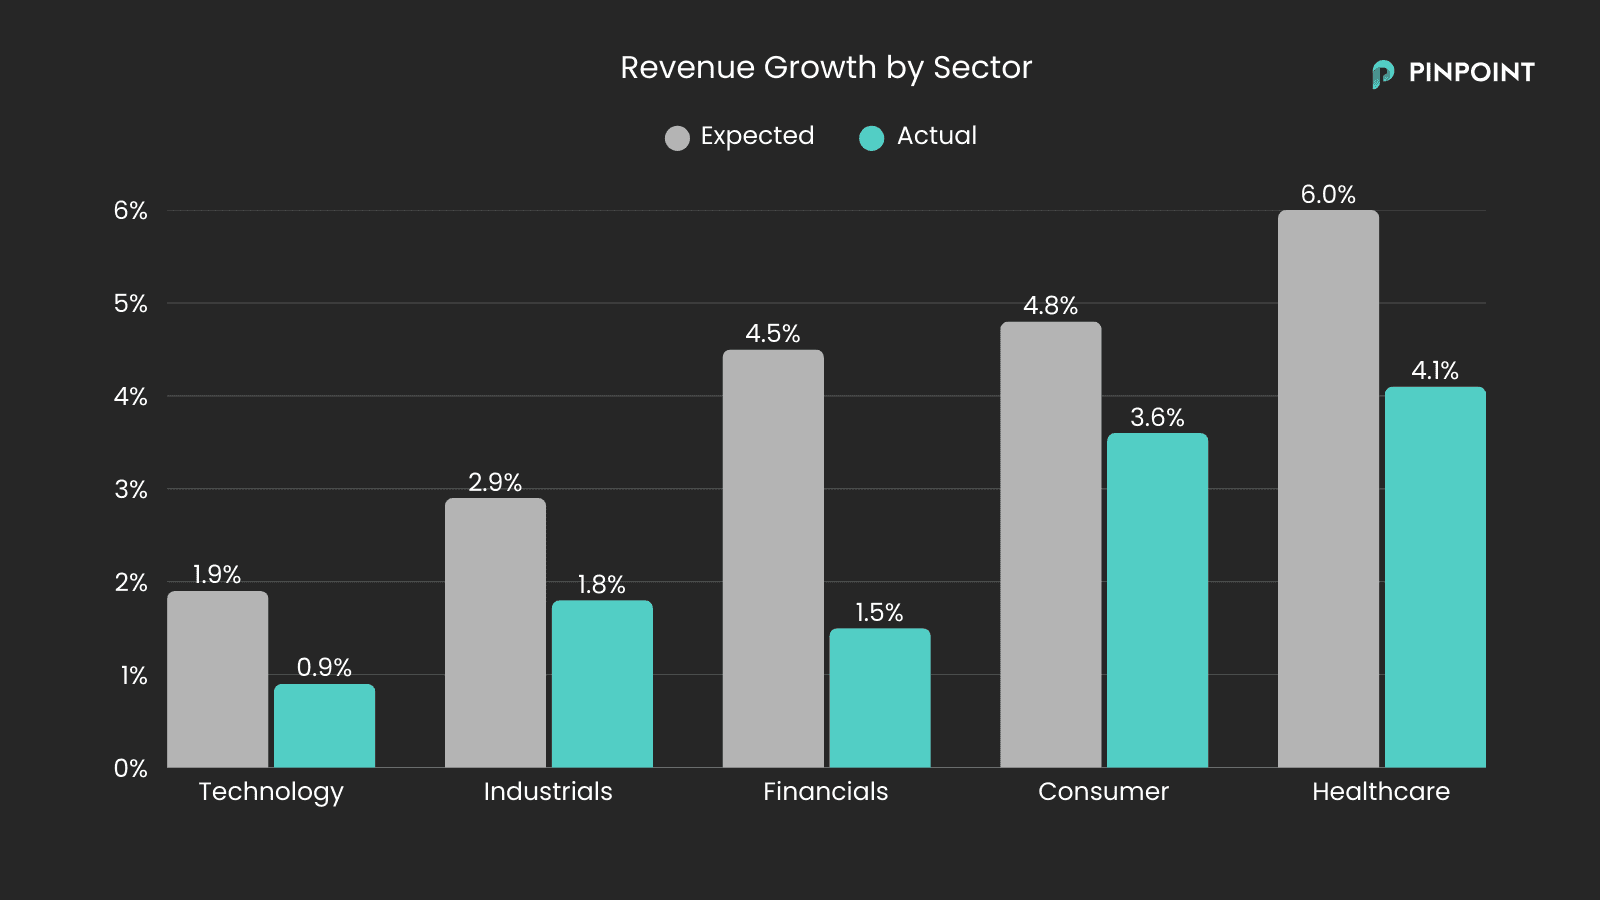
When breaking down growth by sector, we see that all sectors reported lower growth than expected during the fourth quarter.
Growth was generally subdued across the board, reflecting the weaker aggregate revenue trend. Healthcare was once again the sector showing the highest growth, but even there, the outcome came in slightly below expectations.
Revenue vs. Consensus
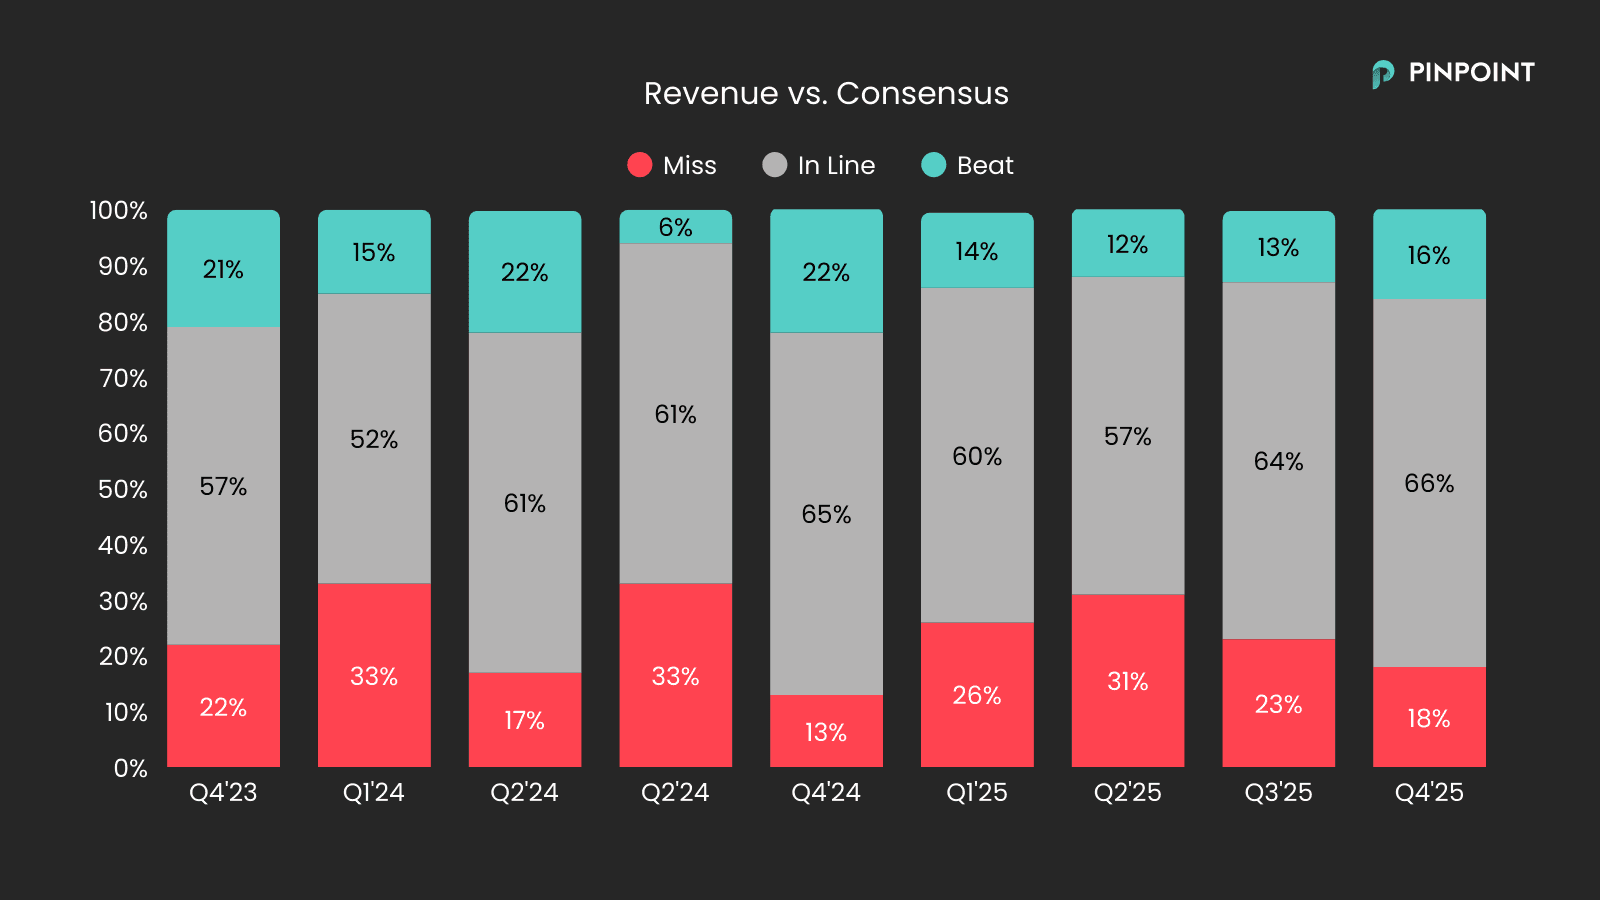
The majority of companies (66%) reported in line with expectations (defined as a deviation of less than 5% from consensus). 16% exceeded forecasts, while 18% came in lower than expected.
This presents a slightly more stable picture than in previous quarters. Although more companies missed than beat expectations, the share of companies beating forecasts (16%) was the highest recorded in 2025.
Earnings vs. Consensus
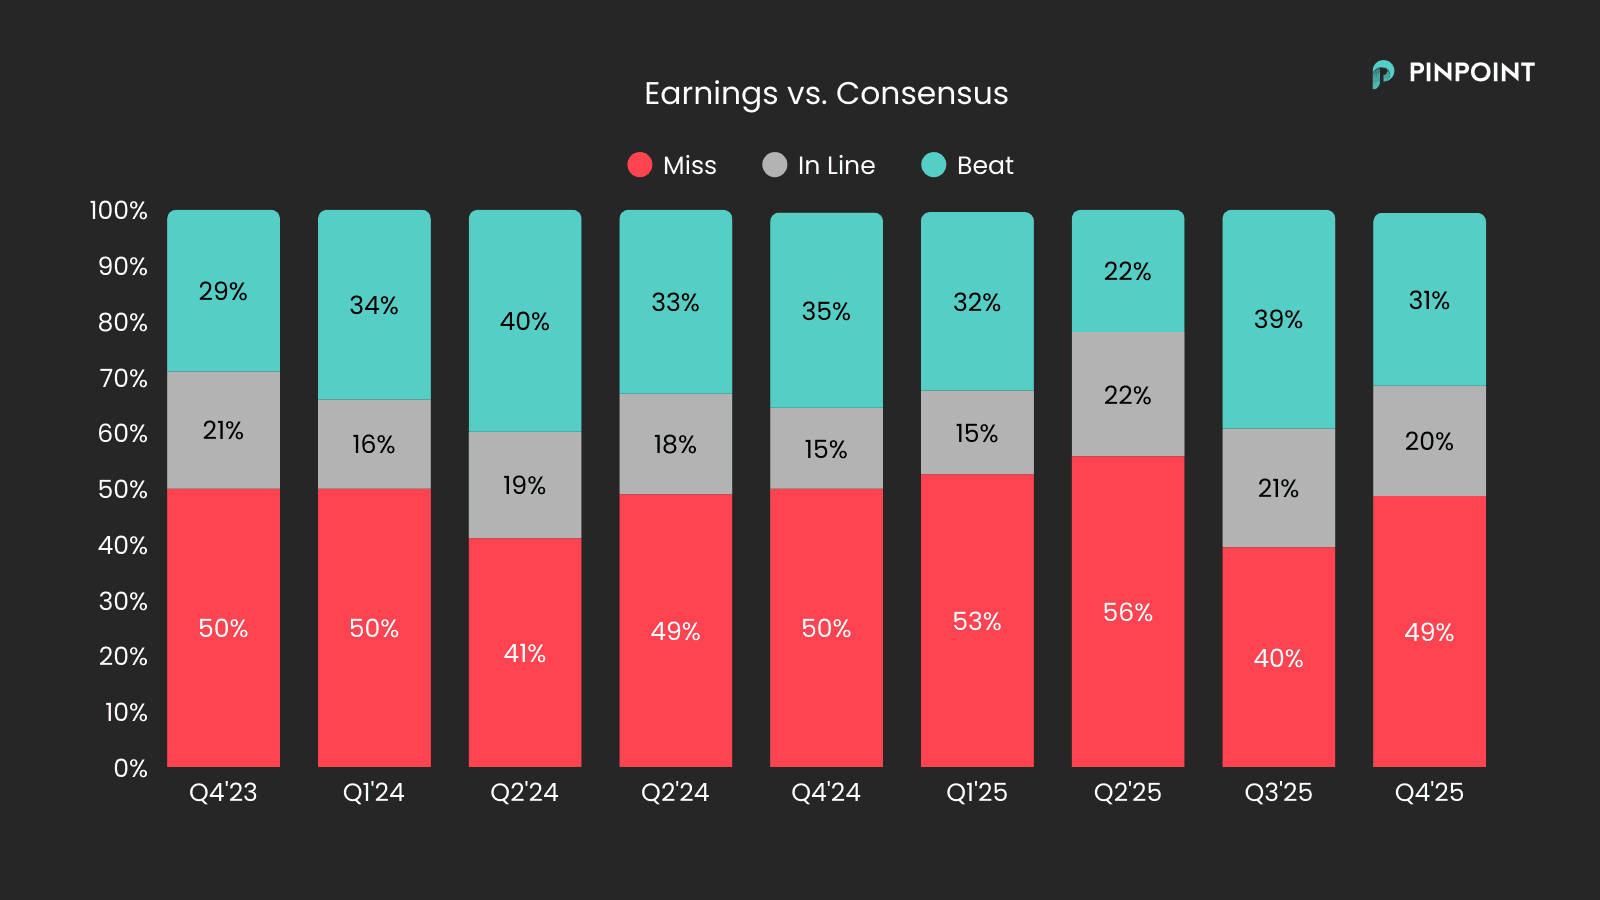
Earnings tend to fluctuate more than revenue, and the spread remained wider this quarter. 31% of companies exceeded expectations, which is in line with historical levels. 20% reported in line with consensus, while approximately 49% missed.
Despite the relatively high share of negative deviations, earnings on an aggregate level developed largely as expected. This indicates that many of the companies that missed did so with limited deviations.
Actual vs. Consensus by Market Cap
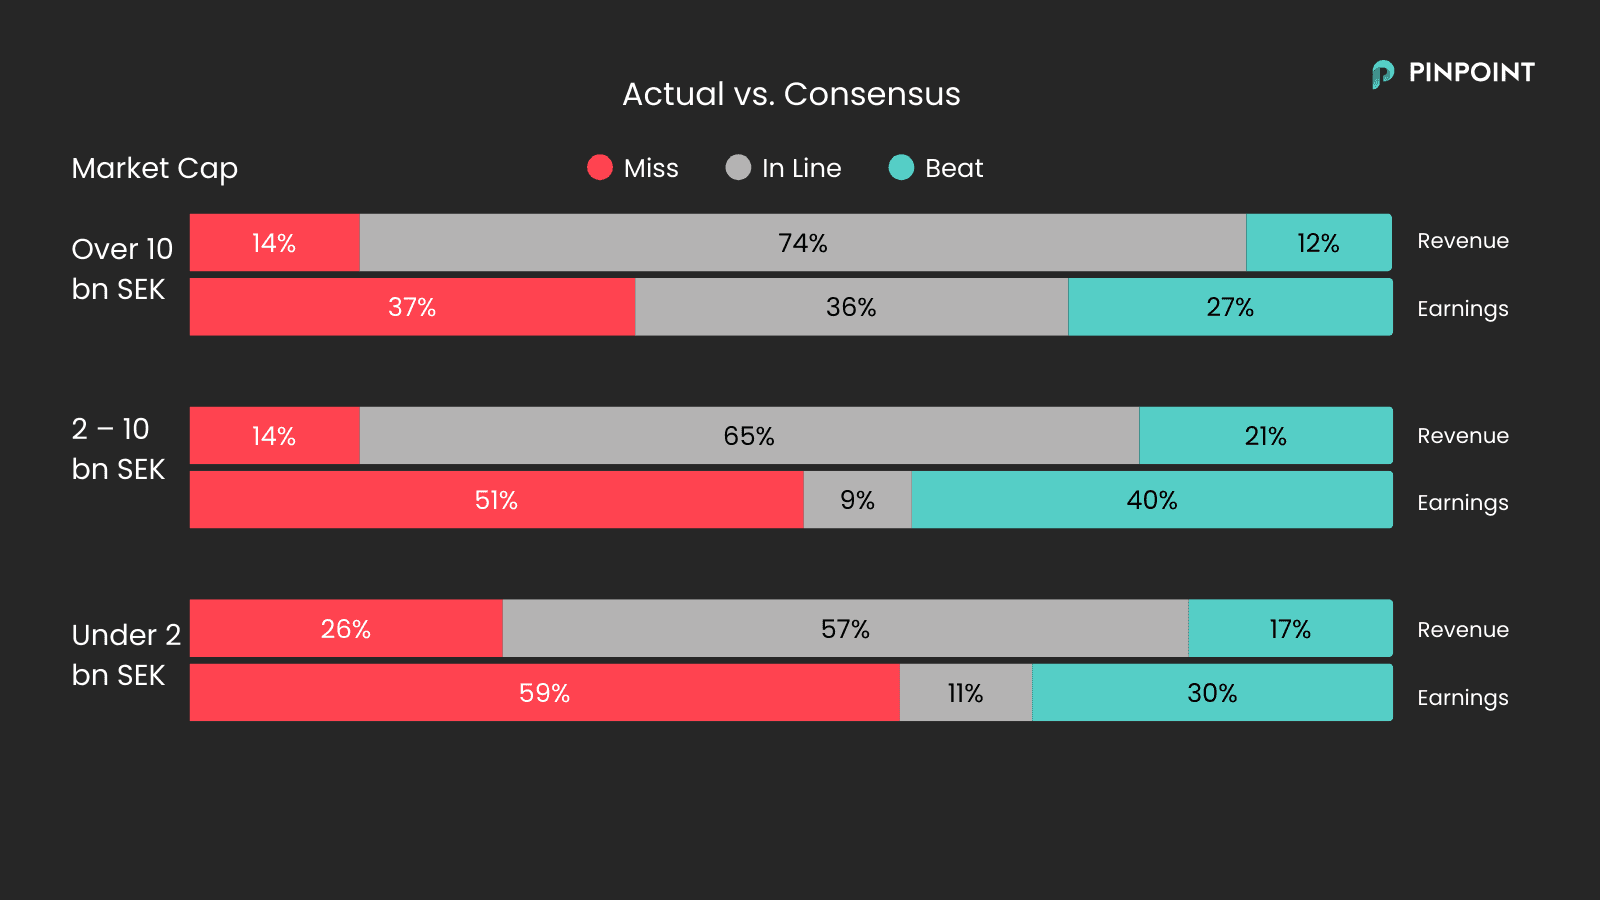
Breaking down the results by company size shows that the medium size businesses (often referred to as small-caps) with a market cap of 2–10 bn SEK had a relatively strong reporting period. 21% exceeded revenue expectations and 40% exceeded earnings expectations—outperforming both the largest and the smallest companies.
As usual, smaller companies are more difficult to forecast, which is natural as their earnings often vary more over time.
Report Winners of the Quarter
Company | Price Reaction | Revenue Beat/Miss | Earnings Beat/Miss | |
1. | Zinzino | +31,4% | -2% | +55% |
2. | BTS Group | +30,6% | -6% | -14% |
3. | QleanAir | +25,4% | +4% | +72% |
4. | Instalco | +25,3% | +7% | +24% |
5. | RevolutionRace | +23,8% | +0% | +10% |
Report Losers of the Quarter
Company | Price Reaction | Revenue Beat/Miss | Earnings Beat/Miss | |
1. | Nelly Group | -39,8% | +0% | -18% |
2. | Fractal Gaming Group | -39,7% | -11% | N/A (miss) |
3. | Tobii | -30,0% | -16% | N/A (miss) |
4. | CTT Systems | -26,3% | -28% | -55% |
5. | OssDsign | -25,3% | -8% | N/A (miss) |
Sharp Report Reactions – Again
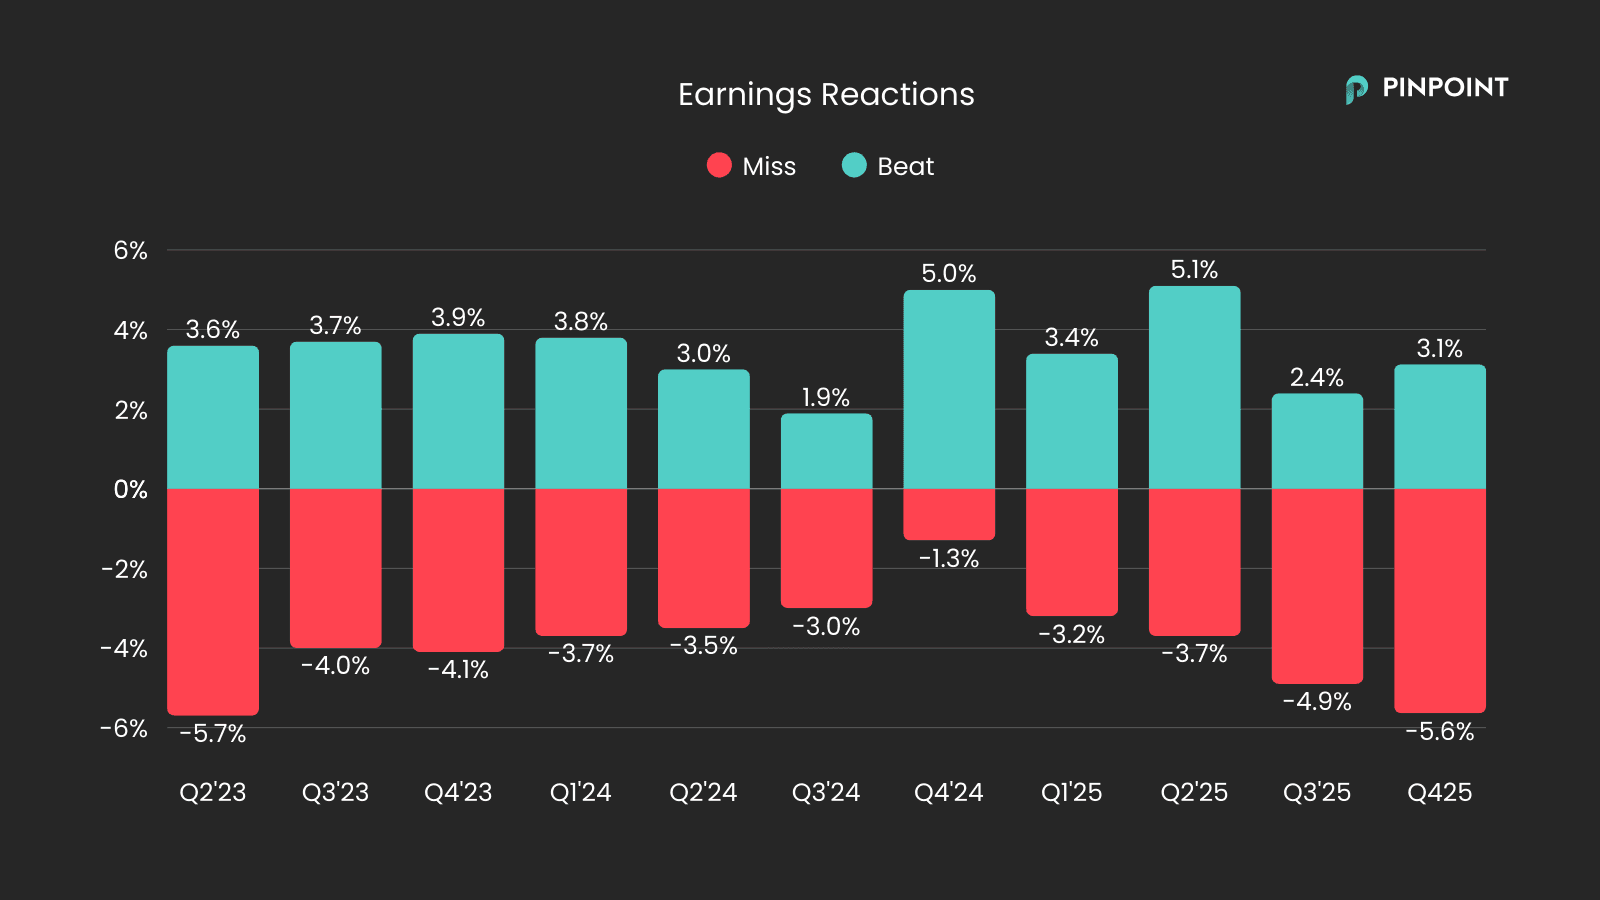
The reporting period was once again characterized by sharp price movements in both directions—but primarily to the downside.
Companies that missed expectations were punished severely. The average price reaction for these was -5.6%, while companies that exceeded expectations rose by an average of +3.1%. Negative deviations were thus penalized nearly twice as heavily as positive surprises were rewarded.
This is the fourth consecutive quarter where negative reactions have intensified. The drivers behind this trend are difficult to pin down. It could involve large outflows, report days serving as liquidity events, or a more general uncertainty regarding future outlooks. Whatever the cause, the data shows a clear "negative bias," where downside misses have a greater impact on stock prices than corresponding positive surprises.
Profit Warnings
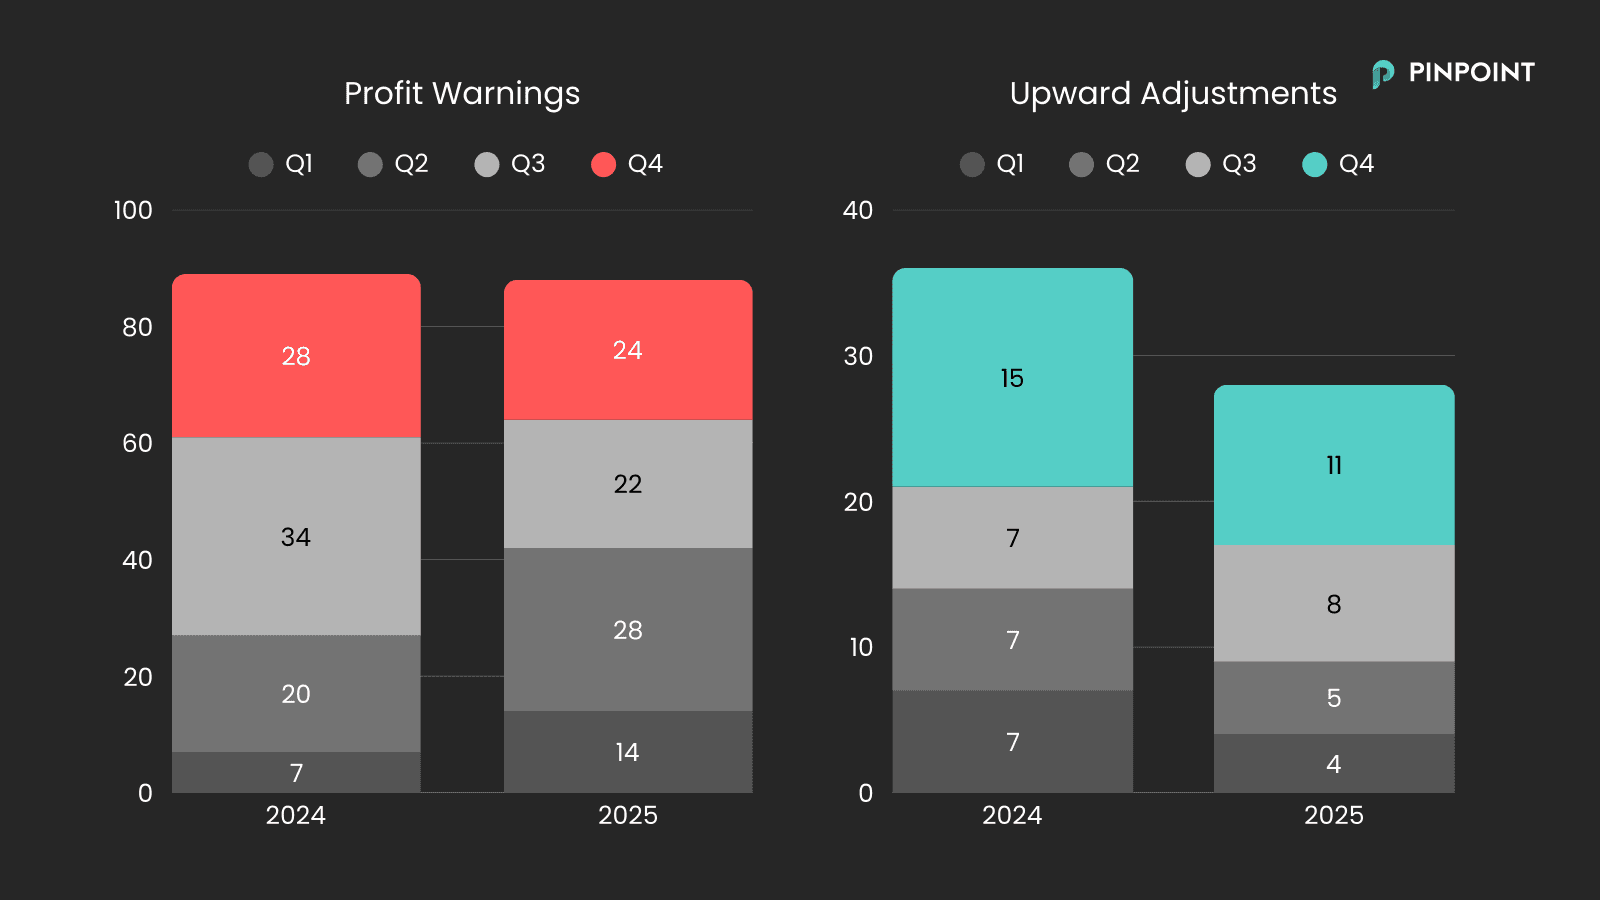
Overall, the number of profit warnings was relatively unchanged compared to the previous year. We noted more during the first half of the year and fewer during the second. Given the sharp price reactions, one might wonder if more companies should have updated the market sooner?
The number of positive profit revisions (reverse profit warnings) was lower than the previous year.
Expected Growth – 2026
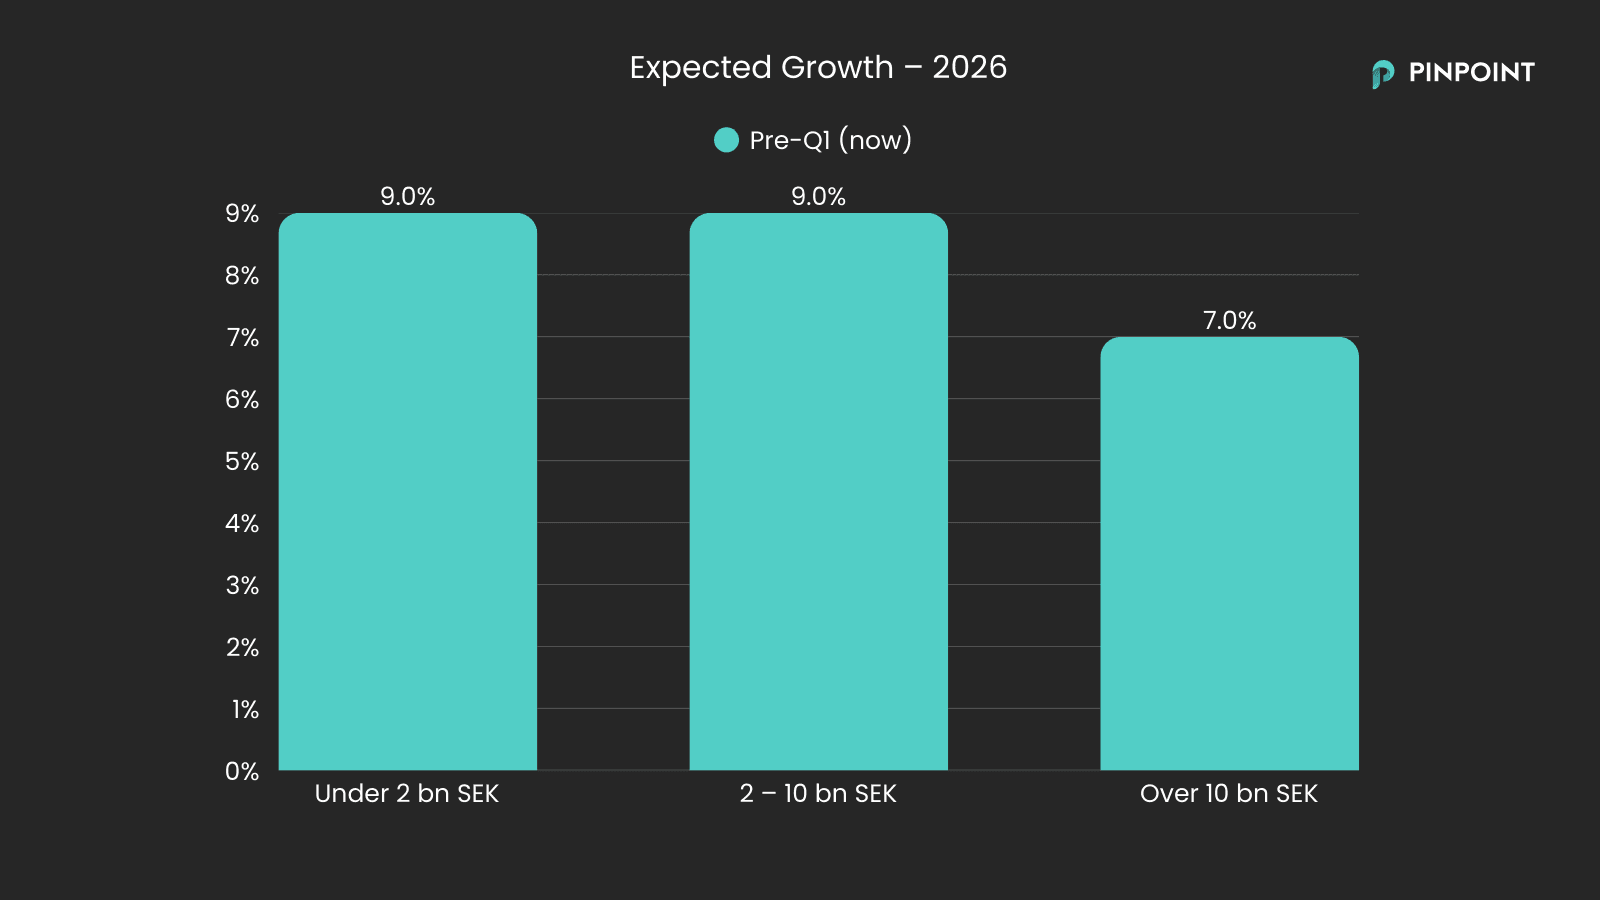
Heading into 2026, growth is expected across all market cap tiers. Small and mid-cap companies are expected to grow by around +9%, while larger companies are projected to increase revenue by approximately +7%.
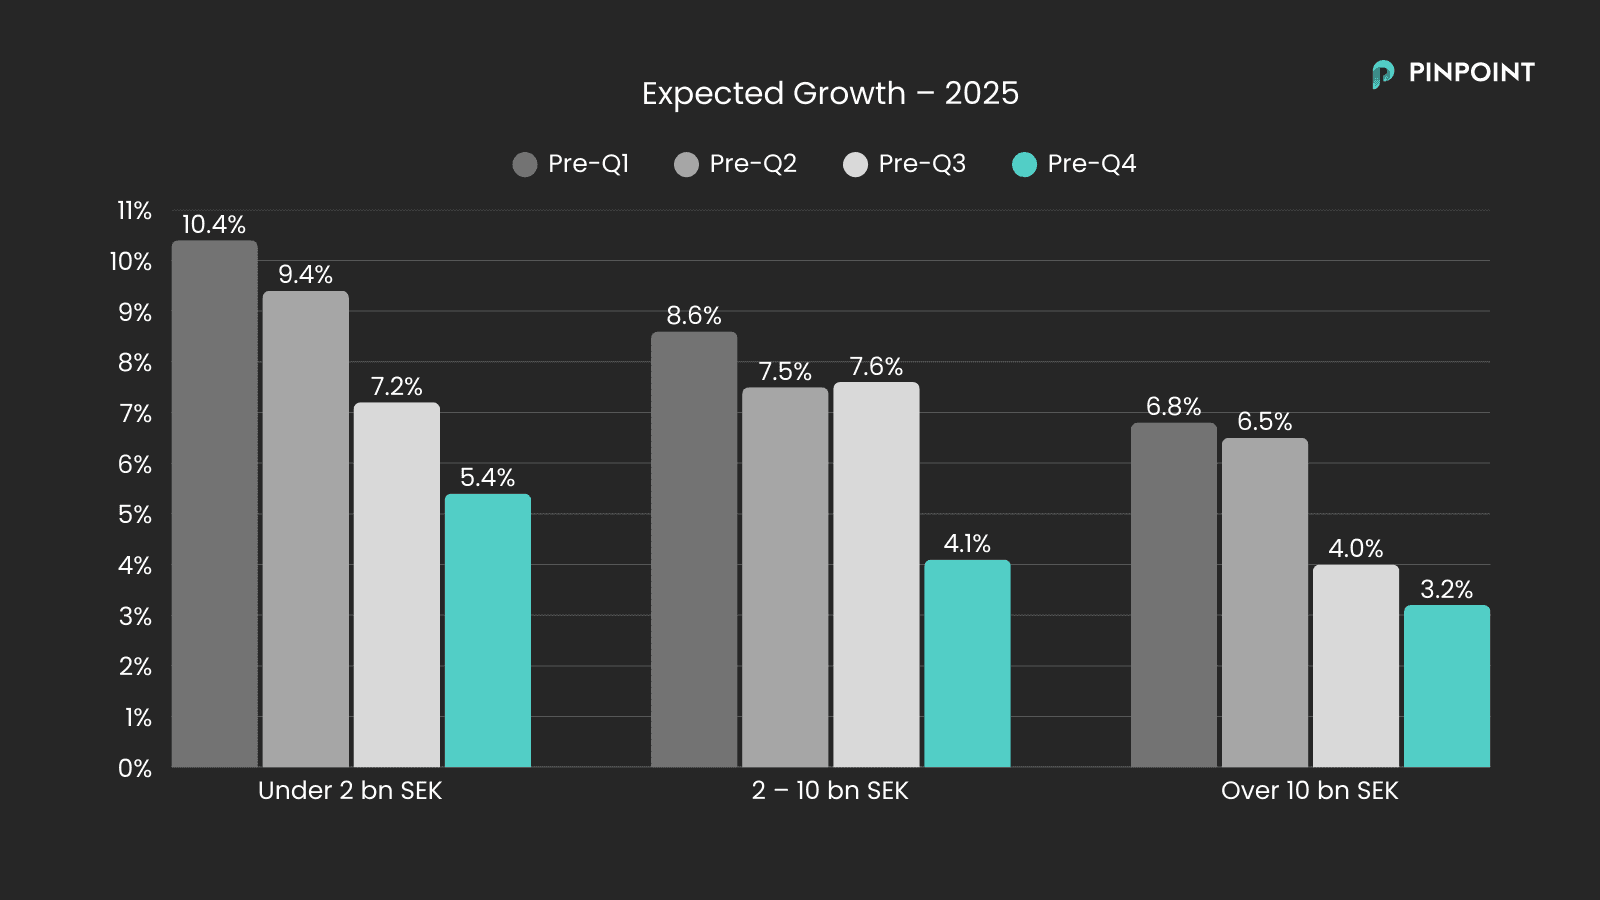
Entering 2025, we saw a similar expectation profile, where smaller companies were expected to grow faster than larger ones—which turned out to be the case. At the same time, expectations were revised downward successively after each reporting season (see chart below).
Whether this pattern repeats in 2026 remains to be seen.
Thank you!
Thank you for contributing to a clearer consensus for hundreds of listed companies by submitting your estimates during the quarter.
Visit Pinpoint to stay updated on the consensus for your favorite companies ahead of the upcoming quarterly and full-year reports.