Crowdsourced Estimates.
For everyone.
Make better investment decisions with a transparent picture of the market expectations of listed companies'. Get started with Pinpoint Estimates today - your estimate counts!
Pinpoint Estimates for Listed Companies
Proactively address market expectations and gain valuable insights in connection to reporting periods.
Read more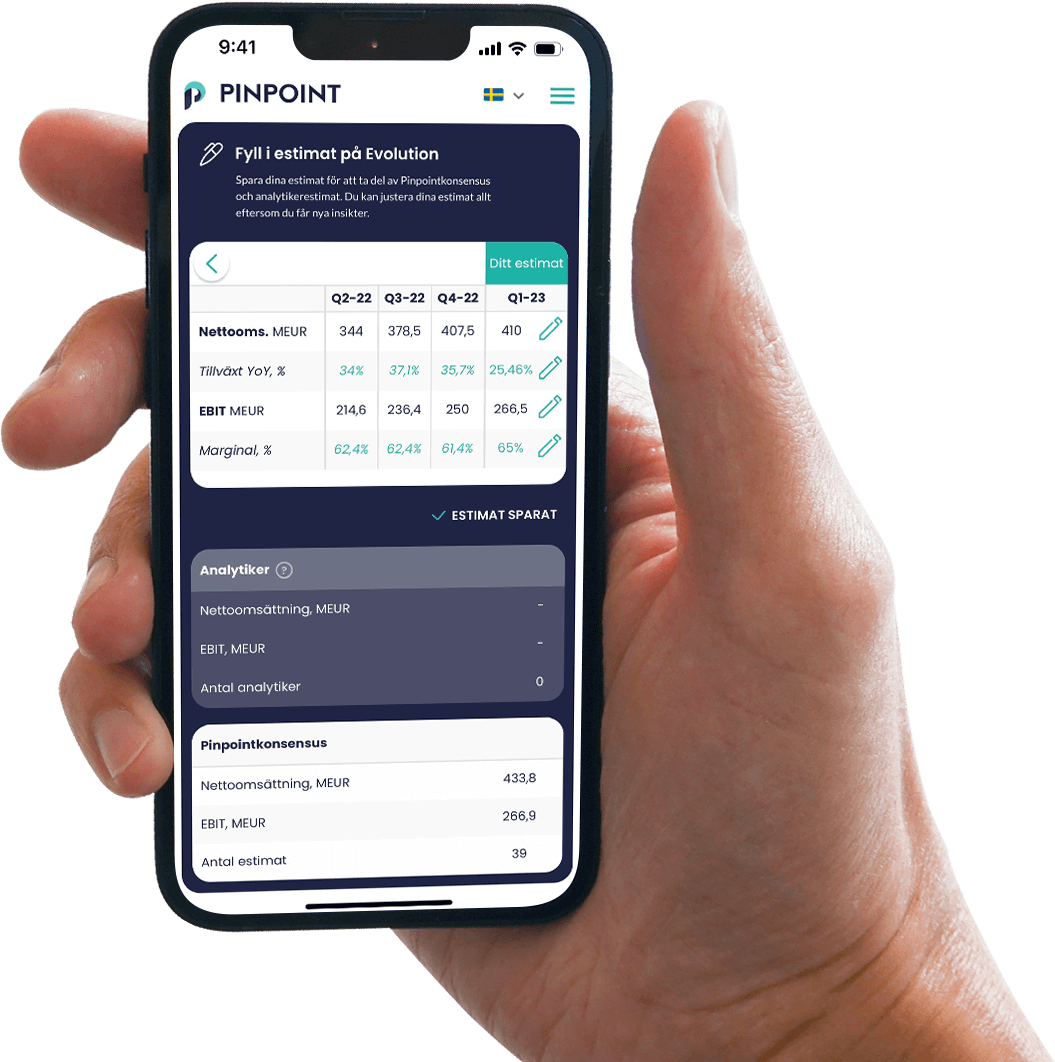
Top Lists
Latest Comments


15000+
Registered users
>70%
In over 70 percent of the cases, the Pinpoint consensus on profit corresponds with the share price reaction on the report day.
"It is incredibly interesting to see the expectations of other investors. We provide estimates ourselves to gain access to Pinpoint's consensus."
- Ola, Markus & Claes
Kvalitetsaktiepodden

Get started with Pinpoint Estimates
1. Search among thousands of Nordic companies and popular American listed companies
On the platform, you will find companies from across the Nordic region, regardless of which list they are listed on or their size. In addition, popular American companies are now also available on the platform. Search for your favorite companies, or discover interesting ones by sorting through upcoming reports, sectors, or the number of estimates from other investors!


2. Submit estimate
Pinpoint is based on the theory of the wisdom of the crowd. As soon as you submit your estimate for a listed company, you unlock a world of crowdsourced forward-looking data. Your estimate is a part of the market's expectation. Estimate to see!
3. Access market's expectations
Compare your forecast with other investors, Pinpoint consensus and analyst estimates from assignment analyses. With forward-looking data, you get better conditions for making more informed investment decisions!
